Plot the robust regression or explanation from slise
Usage
# S3 method for slise
plot(x, type = NULL, title = NULL, ...)
Arguments
- x
The slise object
- type
The type of plot ("2D", "bar", "distribution", "mnist", "prediction", "wordcloud")
- title
The title of the plot (may include a `%s`, which will be replaced by the prediction)
- ...
Arguments passed on to
plot.slise_2d,plot.slise_bar,plot.slise_distribution,plot.slise_mnist,plot.slise_prediction,plot.slise_wordcloudlabelsThe axis labels (default: c("X", "Y") or c("x", "f(x)"))
partialShould the raw ggplot2 objects be returned instead of directly plotting (default: FALSE)
sizeThe size of the plot elements (default: 2)
signifThe number of significant digits to display (default: 3)
widthThe width of the image (width * height == ncol(X))
heightThe height of the image (width * height == ncol(X))
plotsThe number of plots to split the explanation into (default: 1)
tresholdTreshold for ignored value (default: 1e-8)
localOnly display the words relevant for the explained item (default: TRUE)
Examples
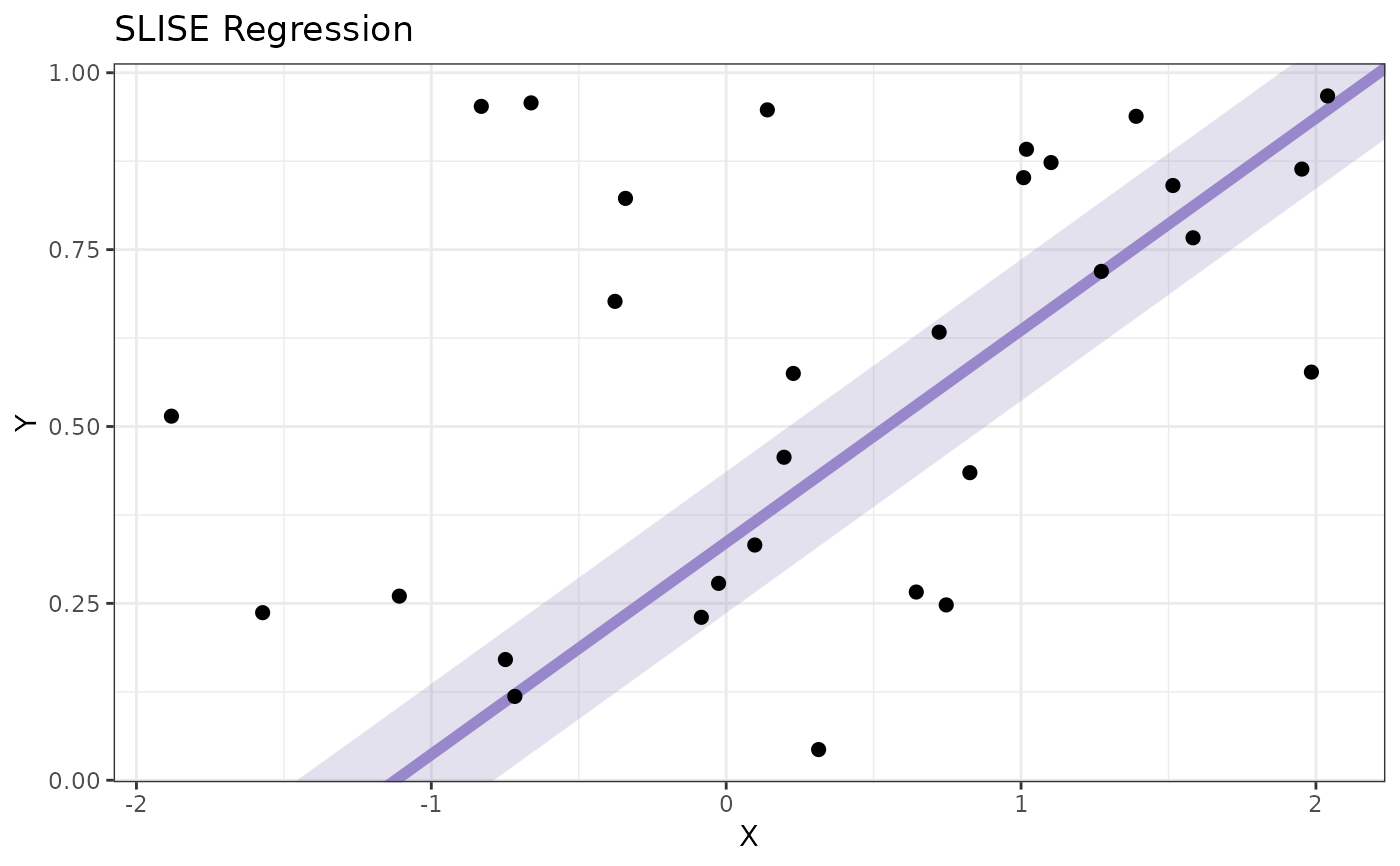
X <- matrix(rnorm(30), 30, 1)
Y <- runif(30, 0, 1)
plot(slise.fit(X, Y, epsilon = 0.1))
#> Warning: The `<scale>` argument of `guides()` cannot be `FALSE`. Use "none" instead as
#> of ggplot2 3.3.4.
#> ℹ The deprecated feature was likely used in the slise package.
#>   Please report the issue to the authors.